Traffic recorder and analyzer for digital substations
May 22, 2025
Network traffic analyzer
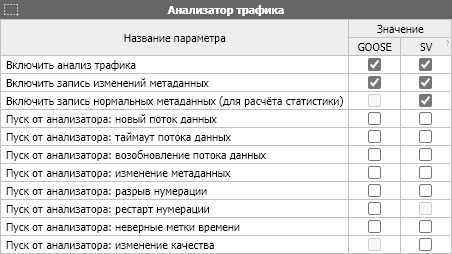
AURA recorders analyze IEC 61850-9-2 and IEC 61850-8-1 GOOSE network traffic. They can trigger recording when an anomaly is detected and/or log all metadata changes in visible traffic, including traffic not defined in the configuration. This function uses approximately 15% of the recorder’s processing capacity and a small amount of disk space.
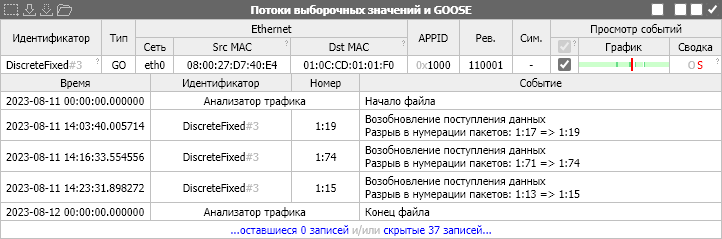
Recorded traffic metadata changes are displayed by calendar day, using local time boundaries. The table at the top lists every stream active during any part of the selected day. The “Chart” and “Summary” columns show whether notable events occurred. Below are event charts for selected SV streams, stream statistics and decoded events. When no streams are selected, a recording calendar is displayed instead of stream details.
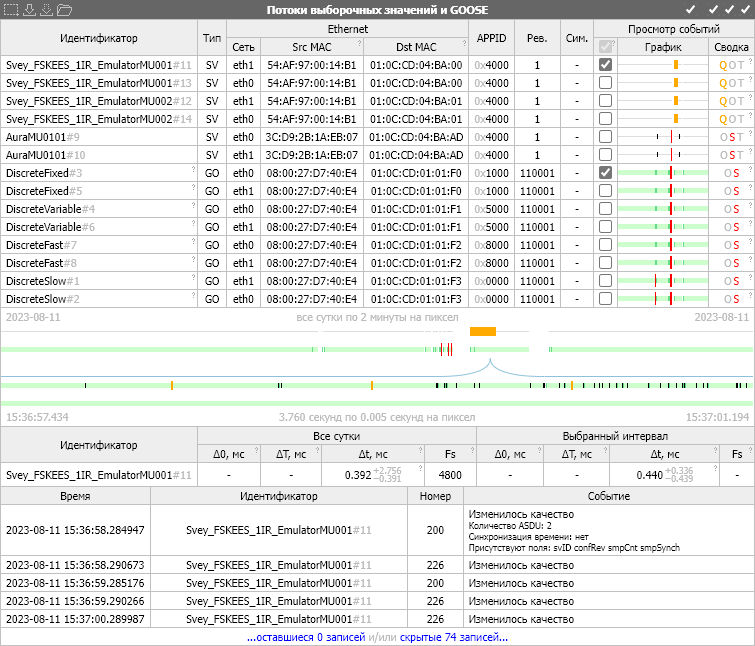
Chart symbols, in the “Chart” column and below:
- Solid white: the analyzer was not running and no recording took place;
- Gray line: the analyzer was running but no data was received;
- Pale green — data was received, with no recording;
- Green: data was received and recorded;
- Black — data reception timeout;
- Orange — changes were detected that are presumed normal;
- Red — anomalies were detected. See the event details;
Event timelines for the selected streams appear below the stream list. Each stream is plotted twice. The upper plot covers a full day in local time, while the lower plot covers the selected interval, from 0.720 seconds to 4 hours. A scale indicator between the plots shows which portion of the daily plots the interval plots represent.
Statistics for the selected SV streams can be displayed below the timelines, with daily statistics on the left and statistics for the selected interval on the right. The following values are calculated.
- Δ0 — offset of the zero-sample arrival time from the start of the second;
- ΔT — time interval between consecutive zero-index samples;
- Δt is the interval between consecutive messages;
- Fs — observed number of samples between zero samples;
Below the statistics is a list of events for the selected streams and time interval. Events can be hidden or expanded as needed. The current view, including a full day of data and the fully functional viewer, can be saved as a single .html file for sharing or archiving.
Performance
The following examples show combinations of traffic that one AURA-61850 recorder can capture and analyze.
| Recorded signal counts and parameters | ||||
|---|---|---|---|---|
| Example 1 | ||||
| 600 analog signals in 75 Sampled Values streams, each carrying eight INT32 signals sampled at 4,000 Hz, with one data block per message (9-2 LE) | ||||
| 2400 binary signals in 150 GOOSE streams, with 16 Boolean signals in each stream. The binary signals in each stream change in turn at a rate of 250 changes per second, for a total of 37,500 changes per second | ||||
| PRP, traffic recording and analysis | ||||
| Example 2 | ||||
| 375 analog signals in 125 Sampled Values streams, each carrying three INT32 signals sampled at 4,800 Hz, with two data blocks per message (F4800S2I3U0 / F4800S2I0U3) | ||||
| 2000 binary signals in 125 GOOSE streams, each carrying 16 Boolean signals, with each stream’s binary signals changing in sequence at 250 changes per second (31,250 changes per second in total) | ||||
| PRP, traffic recording and analysis | ||||
| Example 3 | ||||
| 270 analog signals in 90 Sampled Values streams, each carrying 3 INT32 signals sampled at 14400 Hz, with 6 data blocks per message (F14400S6I3U0 / F14400S6I0U3) | ||||
| 1,440 binary signals in 90 GOOSE streams, with 16 Boolean signals in each stream. The binary signals in each stream change in turn at a rate of 250 changes per second, for a total of 22,500 changes per second | ||||
| PRP, traffic recording and analysis | ||||